
For years Americans have been relocating from blue states to red states in search of jobs and affordable housing. The heavy-handed lockdown policies of governors in some blue states will no doubt accelerate this trend. Adding insult to injury is the disproportionately high death rate of COVID-19 patients in some of these states (See Graphs 1, and 2 below, and Table 1 below).


In all fairness, many blue states are more urbanized and population density plays a major role in spreading the virus, but this fails to explain why people already infected with coronavirus are dying at a higher rate in many of these states (Graph 2). It also fails to explain how some highly urbanized states like Utah and Florida manage to keep their death rates so much lower than death rates in comparably urbanized states like New York and Connecticut (Tables 2 and 3).


When states are sorted in order of deaths per 1,000 cases, an important pattern becomes evident (Table 3): Nursing homes in five of the seven worst affected states were ordered or paid to take in recovering COVID-19 patients. Massachusetts rescinded this requirement after objections from the medical community, but New York, New Jersey, Pennsylvania, and Michigan doubled down and turned their nursing homes into slaughterhouses for the elderly.
Instead of owning up to this mistake, the state of New York is trying to minimize the evidence by excluding nursing home residents who died in hospitals from their tally of nursing home deaths.
Another pattern evident in Table 2 is that nearly all states with more than 60 deaths per 1,000 cases scored low on fiscal health in 2018. Four of them (Connecticut, Massachusetts, New Jersey, and New York) ranked among the 10 worst in this parameter (Table 3). These four state were also ranked by another source among the 10 worst for infrastructure.

Connecticut and Massachusetts did not force nursing homes to accept COVID-19 patients, but lack of state funding may have compromised their ability to protect nursing homes. Louisiana’s fiscal health is not as poor as that of these two states, but 30% of its population is African-American and for various reasons people in this group are dying from COVID-19 at double the overall rate.
In sharp contrast to the nearly bankrupt states of New York and New Jersey, Florida focused its resources on protection of nursing homes with frequent testing and isolation of anyone testing positive. Consequently, even though Florida ranks first in percent of residents over 65, it currently ranks 25 out of 50 for death rate. Florida is also among the few states currently open despite blistering criticism from the media. The sunshine state already ranks fourth best in the nation for fiscal health. Re-opening for business (with necessary precautions) will no doubt keep Florida in a better position to continue providing resources for the elderly.
Budgetary mismanagement goes hand-in-hand with progressivism (Graph 3). This is why President Trump raised concerns about sending more federal aid to these states. Unsurprisingly, governors reluctant to open their states complain that this will undermine their ability to provide social services to the less fortunate.

William Simon, who served as Treasury secretary under President Ford got the same treatment from the media after he refused to bail out New York City. Simon called out their lack of self-awareness by pointing out that New York’s deficit spending was responsible for “the cruelest tax of all -inflation, under the guise of being compassionate.” Indeed. If these worst-affected states are cash-strapped because of their “compassion”, why were they losing so many residents as far back as 2016?
The blue state model has never been about empowering the most vulnerable. It has always been about empowering the ruling class by means of grievance-driven constituencies, utopian fantasies, bloated bureaucracies, and deficit spending. The procrustean lockdown policies of governors in most blue states puts on full display their dismissive attitude towards blue-collar jobs. Too bad it took a world pandemic and the near total destruction of the small business community to expose this mockery of America’s founding principles.
Table Credits: Data for political affiliation for 2015, 2016, and 2017 is from Gallup. Fiscal health scores comes from the Mercatus Center. Coronavirus data (accessed on May 14, 2020) is from USA Today.
Table 1: Data sorted in order of political affiliation. The 12 most progressive states are highlighted in blue. The 12 most conservative states are highlighted in red.
Table 2: Data sorted in order of deaths per million state inhabitants. The 12 most progressive states are highlighted in blue. The 12 most conservative states are highlighted in red.
Table 3: Data sorted in order of deaths per 1000 cases of coronavirus. The 12 most progressive states are highlighted in blue. The 12 most conservative states are highlighted in red.
Table 4: Data sorted in order of fiscal health. The 12 most progressive states are highlighted in blue. The 12 most conservative states are highlighted in red.
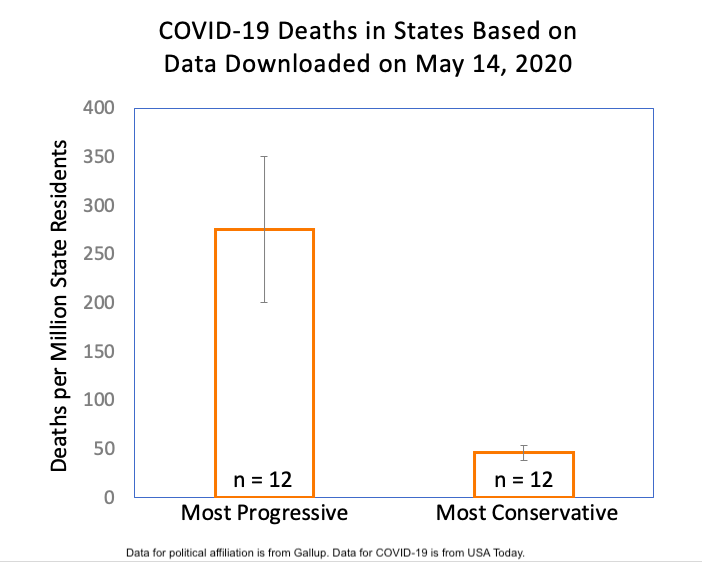
Graph 1: Mean death rates per million state inhabitants in most progressive and conservative states. Based on a T-test, the difference is significant at p = 0.005. Error bars represent standard error.
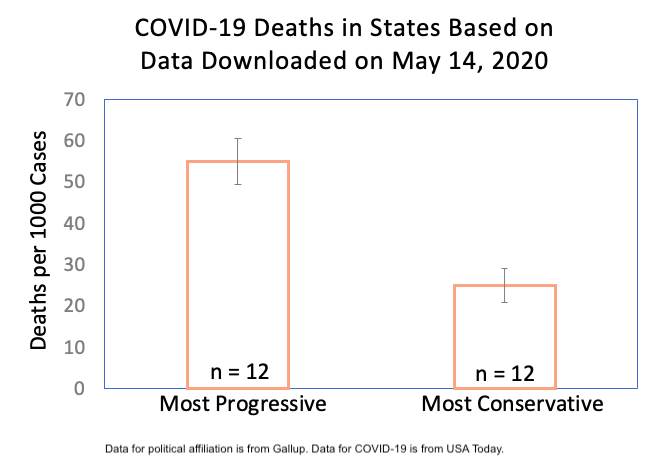
Graph 2: Mean death rates per thousand cases of coronavirus in most progressive and conservative states. Based on a T-test, the difference is significant at p = 0.0001. Error bars represent standard error.
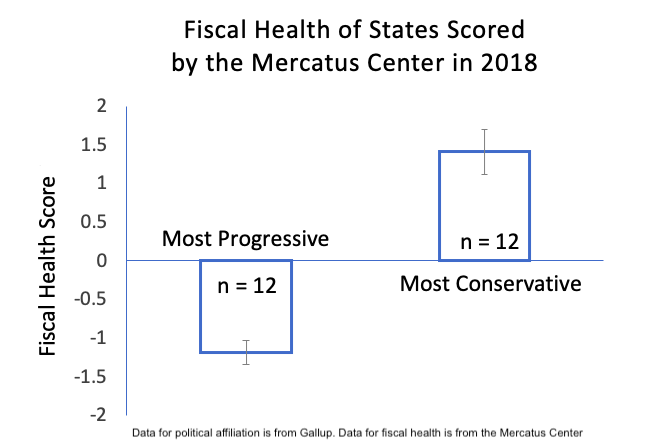
Graph 3: Mean fiscal health scores in most progressive and conservative states. Based on a T-test, the difference is significant at p = 0.00001. Error bars represent standard error.
Antonio Chaves teaches biology at a local community college. His interest in economic and social issues stems from his experience teaching environmental science.
Image credit: Pixabay public domain
For years Americans have been relocating from blue states to red states in search of jobs and affordable housing. The heavy-handed lockdown policies of governors in some blue states will no doubt accelerate this trend. Adding insult to injury is the disproportionately high death rate of COVID-19 patients in some of these states (See Graphs 1, and 2 below, and Table 1 below).
In all fairness, many blue states are more urbanized and population density plays a major role in spreading the virus, but this fails to explain why people already infected with coronavirus are dying at a higher rate in many of these states (Graph 2). It also fails to explain how some highly urbanized states like Utah and Florida manage to keep their death rates so much lower than death rates in comparably urbanized states like New York and Connecticut (Tables 2 and 3).
When states are sorted in order of deaths per 1,000 cases, an important pattern becomes evident (Table 3): Nursing homes in five of the seven worst affected states were ordered or paid to take in recovering COVID-19 patients. Massachusetts rescinded this requirement after objections from the medical community, but New York, New Jersey, Pennsylvania, and Michigan doubled down and turned their nursing homes into slaughterhouses for the elderly.
Instead of owning up to this mistake, the state of New York is trying to minimize the evidence by excluding nursing home residents who died in hospitals from their tally of nursing home deaths.
Another pattern evident in Table 2 is that nearly all states with more than 60 deaths per 1,000 cases scored low on fiscal health in 2018. Four of them (Connecticut, Massachusetts, New Jersey, and New York) ranked among the 10 worst in this parameter (Table 3). These four state were also ranked by another source among the 10 worst for infrastructure.
Connecticut and Massachusetts did not force nursing homes to accept COVID-19 patients, but lack of state funding may have compromised their ability to protect nursing homes. Louisiana’s fiscal health is not as poor as that of these two states, but 30% of its population is African-American and for various reasons people in this group are dying from COVID-19 at double the overall rate.
In sharp contrast to the nearly bankrupt states of New York and New Jersey, Florida focused its resources on protection of nursing homes with frequent testing and isolation of anyone testing positive. Consequently, even though Florida ranks first in percent of residents over 65, it currently ranks 25 out of 50 for death rate. Florida is also among the few states currently open despite blistering criticism from the media. The sunshine state already ranks fourth best in the nation for fiscal health. Re-opening for business (with necessary precautions) will no doubt keep Florida in a better position to continue providing resources for the elderly.
Budgetary mismanagement goes hand-in-hand with progressivism (Graph 3). This is why President Trump raised concerns about sending more federal aid to these states. Unsurprisingly, governors reluctant to open their states complain that this will undermine their ability to provide social services to the less fortunate.
William Simon, who served as Treasury secretary under President Ford got the same treatment from the media after he refused to bail out New York City. Simon called out their lack of self-awareness by pointing out that New York’s deficit spending was responsible for “the cruelest tax of all -inflation, under the guise of being compassionate.” Indeed. If these worst-affected states are cash-strapped because of their “compassion”, why were they losing so many residents as far back as 2016?
The blue state model has never been about empowering the most vulnerable. It has always been about empowering the ruling class by means of grievance-driven constituencies, utopian fantasies, bloated bureaucracies, and deficit spending. The procrustean lockdown policies of governors in most blue states puts on full display their dismissive attitude towards blue-collar jobs. Too bad it took a world pandemic and the near total destruction of the small business community to expose this mockery of America’s founding principles.
Table Credits: Data for political affiliation for 2015, 2016, and 2017 is from Gallup. Fiscal health scores comes from the Mercatus Center. Coronavirus data (accessed on May 14, 2020) is from USA Today.
Table 1: Data sorted in order of political affiliation. The 12 most progressive states are highlighted in blue. The 12 most conservative states are highlighted in red.
Table 2: Data sorted in order of deaths per million state inhabitants. The 12 most progressive states are highlighted in blue. The 12 most conservative states are highlighted in red.
Table 3: Data sorted in order of deaths per 1000 cases of coronavirus. The 12 most progressive states are highlighted in blue. The 12 most conservative states are highlighted in red.
Table 4: Data sorted in order of fiscal health. The 12 most progressive states are highlighted in blue. The 12 most conservative states are highlighted in red.
Graph 1: Mean death rates per million state inhabitants in most progressive and conservative states. Based on a T-test, the difference is significant at p = 0.005. Error bars represent standard error.
Graph 2: Mean death rates per thousand cases of coronavirus in most progressive and conservative states. Based on a T-test, the difference is significant at p = 0.0001. Error bars represent standard error.
Graph 3: Mean fiscal health scores in most progressive and conservative states. Based on a T-test, the difference is significant at p = 0.00001. Error bars represent standard error.
Antonio Chaves teaches biology at a local community college. His interest in economic and social issues stems from his experience teaching environmental science.
Image credit: Pixabay public domain
via American Thinker
Enjoy this article? Read the full version at the authors website: https://www.americanthinker.com/